Satellite Temperature Trends
There has been some contention over exactly what the satellite data tells us about temperature trends. In particular, analysis of data from the MSU instruments aboard the NOAA satellites has been interpretted in a number of ways.
Nathan Gillet gave us a seminar today where he reported work done on repeating the Fu et al 2004 analysis (in a model). Nathan’s work (coauthored with Ben Santer and Andrew Weaver) showed that the Fu analysis gave a good estimate of actual trends (comparing pseudo obs in the model with actual model values). That being so, the methodology should work in the real atmosphere, which means that the satellite obs are consistent with tropospheric warming and stratospheric cooling associated with greenhouse gas induced climate change.
So, he’s supporting the Fu et al analysis. The bottom line of that analysis is that if you take just the T2 channel of the MSU, the “tropopsheric” channel, you don’t see much trend. However, T2 extends[^1] into the stratosphere, and so
it’s “contaminated” by the stratospheric cooling. However,
Fu and et al (verified by Gillet et al) have shown that you can untangle
the stratospheric signal, and when you do that, the satellites show clear tropospheric warming signals. Here, is the key result from the Fu et al paper:
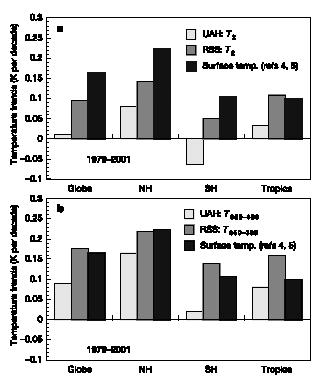 What you see is that in case a) the analyses (two different methods) from satellite don’t give as large a cooling trend as the surface observations (i.e. this is the result that the greenhouse skeptics keep reporting).
However, if one corrects for the stratospheric influence on the T2 channel, one gets the results in b). That is, the satellite data supports the surface analyses (albeit weakly in the SH for the UAH analysis).
[^1]: The weighting function which represents which parts of the atmosphere contribute to the measurement, extends over a vertical region, in this case well into the stratosphere
What you see is that in case a) the analyses (two different methods) from satellite don’t give as large a cooling trend as the surface observations (i.e. this is the result that the greenhouse skeptics keep reporting).
However, if one corrects for the stratospheric influence on the T2 channel, one gets the results in b). That is, the satellite data supports the surface analyses (albeit weakly in the SH for the UAH analysis).
[^1]: The weighting function which represents which parts of the atmosphere contribute to the measurement, extends over a vertical region, in this case well into the stratosphere