Why so much data? Part I - The rise of direct numerical simulation
Over the last decade or so, many in the scientific community (especially in the environmental sciences) have been surprised by the increased cost of data handling - not only in absolute terms, but in terms of the percentage of the cost of doing “normal science”.
This increase has been problematic on a number of fronts: not only do individuals not always plan appropriately for managing their data storage and handling, but even where they have, institutions and funding agencies have themselves been surprised and not always too keen to pay up. After all, in a world where there is very little new money in real terms (or even none), an increase in one part of the budget needs to be offset elsewhere. So, the real consequence of these increases in storage cost have to be decreases in the amount of science done (fewer staff/instruments/computers), and that’s unpalatable even if it’s unavoidable. At the moment many choose to think it is avoidable, which is quite a feasible position if you’re an ostrich, but not so good if you’re responsible for delivering science!
In this post, and maybe a couple to follow, I want to address why data handling is becoming a bigger deal in environmental science, and why we can’t avoid spending more of money on it (but also how we can avoid spending more than we need to).
So, what are the factors in play? Well as well as background economics, there are four:
- The direct influence of Moore’s Law on instrumentation and simulation (finer resolution in space and time means more numbers),
- The indirect influence of Moore’s Law on what can be simulated (more compute means more things are computable),
- The growth of interdisciplinarity (more things need to be compared and contrasted) and more people are doing it, and
- The relationship between Moore’s Law and Kryder’s Law (is the cost of storage falling as rapidly as the cost of creating numbers to be storing is falling?).
Before delving into the technical details, I want to look at one of the underlying scientific trends that arises, partially as a consequence of the “indirect influence of Moore’s Law”: the rise and rise of direct numerical simulation, especially in the environmental sciences.
As noted above, more computability means more things are computable, and when we couple that to increased mathematical sophistication, more and more of the real word is amenable to direct numerical simulation: that is, it can be numerically simulated from fundamental equations rather than approximated by heuristics. The importance of this from a scientific point of view is that if one believes one is simulating the underlying processes properly, one can use the “simulation system” to predict how the system will behave under different circumstances than have been observed (either by coupling it into more complex systems or by using the system to predict past or future behaviour).
To some extent this is the holy grail of science: when one can simulate a system so well that one can’t tell 1 whether one is observing a simulation or the real word, one can believe we understand that part of the real world.
For some time I have been asserting that an ever greater part of environmental science is engaging in direct numerical simulation (DNS), year on year. At the same time, I’ve been asserting that larger and wider communities were interacting around data, and especially around the data from model intercomparison projects, again, year on year. Of course, these assertions were not unrelated!
These assertions were based primarily on my interactions with the scientific community (one of the things about running an environmental data centre for much more than a decade is that my day job has involved interacting with individuals from across the scientific spectrum), and so one might dispute them. However, a year or so ago, I realised I might be able to get some quantitive information to support them by a bit of careful text mining. Unfortunately, I also realised I was never going to get the time to do it properly, so what follows is very amateur, but I hope still interesting. (If you have the skills and access to the data to do this properly, get in touch!)
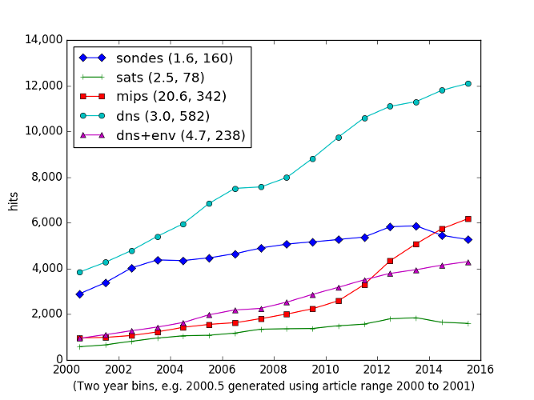
The following figure is generated by spending a lot of time doing searches on Google Scholar (it would have been rather less time if Google didn’t actively stop one doing this sort of work programmatically - I did try, and it worked fine until their “no robot code” stopped me in my tracks). Each point reflects the number of hits from a search on a specific set of terms from material restricted to two years. The terms were chosen to try and reflect five specific categories of interaction:
- direct numerical simulation (across any discipline) - “dns” in the figure,
- direct numerical simulation in the environmental sciences - “dns+env” in the figure,
- model intercomparison projects - “mips”,
- use of satellite data in environmental science - “sats”, and
- regular observations - “sondes”.
(The table at the end of this post gives the details of the exact searches carried out.)
- Google searches for specific terms
The numbers in the legend are firstly the ratio of the last couple of points over the first couple of points - a measure of proportional growth, and secondly, the gradient from a fit to the number of hits per annum - a measure of absolute growth.
The figures back my observations rather nicely:
- The number of papers on any facet of environmental science is growing. (No news there).
- The number of papers using direct numerical simulation is growing rapidly, but the use of DNS in environmental sciences is growing even more rapidly, at least using the proportional measure.
- The increase in papers which use MIP data is explosive, and one can see the direct influence of CMIP5 in the numbers.
- Growth in observational science is slower than in numerical science, although the effect of increased availability of satellite data is apparent.
Obviously these conclusions could be heavily affected by the search terms I used, so if your mileage varies, let me know!
For the record, these are the exact (full text) searches used:
- dns: search for the exact phrase “direct numerical simulation”
- dns+env”: as above, but require one of the following as well: cloud,rain,weather,climate,ocean,atmosphere,land,river,biogeochemistry,aerosol.
- “sat”: search for an exact match on “nadir sounder” (as a proxy for atmospheric satellite data only, and using that as a proxy for environmental science use of satellites in general).
- “mips”: exact match for model intercomparison project AND the use of the word simulation AND either atmosphere OR ocean.
- “sondes”: at least one of “radiosonde” or “dropsonde” appears (being a proxy for any sort of “traditional” observation - words like Lidar and Radar being too difficult to limit to environmental science, at least in this first cut at the problem).
-
We can have a fun discussion in another post, what “one can’t tell” might mean ↩