On Measuring Research Outputs
Our department (Space Science and Technology) within the STFC is undergoing an exercise aimed at measuring our research quality. The mechanism involves bringing together a small panel of folk who go over some metrics, listen to some presentations, and make some recommendations.
It’s been hard for those of us in Earth Observation and Atmospheric Science (and in particular, within the Centre for Envrionmental Data Archival): very little of our income is “for research”, and most of what we do get is very applied research money, but that’s a story for another day.
One of the things the panel did was ask for our “paper” outputs, since 2002, and they did some citation metrics based on that. They did this for all the divisions within the department. The panel does contain representatives from a range of the disciplines within the department, but doesn’t run the entire gamut, so the panel will of necessity have to draw some conclusions based on metrics, rather than an assessment of what they heard …
The difficulty with this of course is that they then have to compare apples with oranges, and by limiting themselves to the last five years they’ve made that task very hard. I suspect the limit was by analogy with the Research Assessment Exercise, but it’s important there to remember that in RAE exercises academics have declared their most important works (explicitly NOT restricted to papers, and expert panels rank the works impact, and they don’t rely on metrics alone!).
As an exercise in the misuse that one can make of a single metric in comparing apples and oranges, I went down to the library and took the first ten papers from the last issue of 2006 in each of one journal from atmospheric science and one from astronomy. For each papers, I simply went through the cited papers and built up a histogram of the year it was published. The raw results are in the two histograms on the left hand column of the following figure:
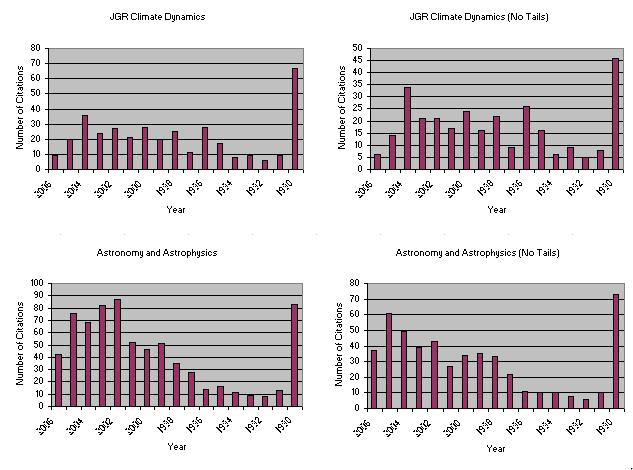
(Note that the papers for years prior to 1990 are lumped into 1990.), The right hand column is the data after removing the two papers with the lowest and highest number of publications since 1991 in a crude attempt to remove “single-paper” bias in my very small sample.
There is one obvious conclusion one can be tempted to draw from these data: Atmospheric science tends to cite older papers!
- In part this is driven by the fact that the time from submission to appearance has traditionally been quite long (longer than other disciplines, and while this is getting better, it’s still appears slower …). (Other factors include the topics involved: if you’re writing a paper about an even that happened in 2002 you might not have as much older material to cite etc etc).
- This introduces a “citation” latency in comparisons: the median year of citations since 1991 is 2001 in astronomy and 1999 in atmospheric science.
- As a consequence, papers since 2002 have a lower impact (in terms of papers since 1991, 38% of papers cited in atmospheric compared with 53% in astronomy).
- If this is a proxy for the impact of any individual’s impact as well … this means the “citation” efficiency of an atmospheric scientist is “lower” than an astronomer.
- Thus, if one restricts the entire analysis to papers since 2002, then the impact of any individual much be lower (in this metric) in atmospheric science than astronomy.
- This is obviously compounded by the number of papers actually published per person, which is much higher in astronomy (I’ll not comment here on why that might be, beyond the obvious statement that different disciplines have different implementation workloads from experiment/observation/simulation conception to results being obtained, even without any analysis time workload issues).
Disclaimer
This analysis isn’t supposed to reflect on the actual worth of either community, simply to say that if one started with the hypothesis that this citation metric measured an individual’s worth, then the numbers will almost force one to conclude that the average astronomer is a better researcher than the average atmospheric scientist. I think you will know that I don’t believe that (in fact I don’t believe that the statement could be proved, one way or the other!). Further, I know the panel didn’t have this explicit comparison in mind, this isn’t meant to be an apologia - this little analysis is simply to show how metrics can take you places you didn’t want to go …