Glaciers Indicate Temperature Increase
Back when I started criticising Michael Crichton, I commented on glacial length from what I freely admitted was a state of ignorance.
However, for some real expert opinion we can cite Oerlemans, 2005, in Science who states that:
Mass-balance modeling for a large number of glaciers has shown that a 25% increase in annual precipitation is typically needed to compensate for the mass loss due to a uniform 1 K warming. These results, combined with evidence that precipitation anomalies normally have smaller spatial and temporal scales than those of temperature anomalies, indicate that glacier fluctuations over decades to centuries on a continental scale are primarily driven by temperature.
Which means that the situation is not simple on the Greenland scale. But as usual, the issue with Crichton is he picks his data to tell his tale. The same Oerlemans article uses glacial records from 169 glaciers world-wide (although he admits a bias to European alpine observations) to construct a global temperature proxy based only on glacial length. The reconstruction is split into regions to avoid the European bias.
He finds that:
Moderate global warming started in the middle of the 19th century. The reconstructed warming in the first half of the 20th century is 0.5 kelvin. This warming was notably coherent over the globe.
Although looking at the figures, the coherency recently is certainly not global, with significant advances in many places. However, I’d be very intrigued to see what would happen if we looked at the precipitation records for the areas of significant advances (e.g. New Zealand). It’s also difficult to argue that NZ is “continental scale” (neither indeed is Greenland, despite the size it gets on Mercator projection maps).
What I found particularly impressive is the figure with the reconstructed temperature series! I’ve snipped a bit of it out so you can get the flavour, although you should look at the original article for the real thing and the axis information:
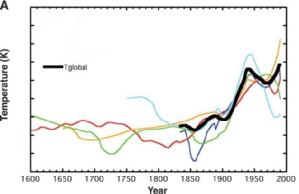
(I’ve deliberately degrated the image by removing the axis information and the line legend, so as to meet my own fairuse criteria.