Solar Irradiance and Sunspot Cycles
For once I’m reading some real scientific literature. I’ve been pretty appalling lately, with my RSS aggregator telling me there are about 1400 items from Science and Nature alone that I should have a quick look at (As well as telling me that I’m not spending enough time keeping abreast of developments, I think this also tells me that I need to use some different software - something that does keyword parsing).
Anyway, today, I felt obliged to catch up on some key details of the solar climate link, and in particular, the solar side of things. I’m reading: Solar variability and climate change: is there a link?, by Sami Solanki. This is all stuff I should have known, and indeed have wittered on about before, albeit not in detail.
Key points from this paper are that
- There are two major cause of solar variability: solar evolution (related to the solar core, and with timescales of billions of years) and magnetic field variability near the solar surface (driven by a dynamo at the bottom of the convection zone in the solar interior). It’s the latter that’s probably of interest for solar climate discussion on the scale of decades and centuries.
- The major ingredients determining the strength and structure of the magnetic field are the (differential) rotation of the Sun and the (turbulent) convection at and below the solar surface. The interaction between these factors leads to bundling of field lines into features which we can see on earth: sunspots.
- The solar magnetic field, and hence the sunspot activity, is strongly time-dependent, and the most obvious examples of this is the 11-year solar cycle, visible in the number of sunspots. This cycle itself varies though, with stronger and weaker amplitudes (so weak in the early 1600’s that sunspots effectively disappeared during the Maunder Minimum), and some variability in cycle length.
- The solar irradiance is a maximum when the number of sunspots is at a maximum, which is initially counter-intuitive (high resolution timeseries of irradiance and sunspots show that the solar output darkens as sunspots transit across the visible solar disk). However, current theory suggests that smaller bunchs of magnetic field lines (faculae) which are not visible as sunspots are associated with solar brightening, that the number of these is correlated with the number of sunspots (and the underlying magnetic activity), and that the solar brightening associated with a maximum of faculae dominates over the simultaneous darkening associated with visible sunspot maximum.
- Support for the important role of the magnetic field at the solar surface is provided by the fact that the irradiance variability can be reproduced quantitatively by a simple three-component model, with the individual components representing the quiet Sun, faculae and sunspots. This reproduces the solar cycle changes quite well.
- However, it is a step further to go to longer (century) timescales. BUT, if one does assume that the relationship between solar activity and irradiance found over the solar cycle also acts over longer times, it is then possible to work out that the Sun was between 2 and 4 W m?2 less bright during the Maunder minimum than today.
- Some evidence to support this assumption (and the conclusion about the irradiance during the Maunder minimum) exists by noting that the underlying magnetic flux from one solar cycle persists into the next cycle, even though the manifestation in terms of sunspots do not correlate between cycles. Solanki has built a model which includes this factor, which reproduces both observed production rates (as measured in ice cores from large glaciers) of an isotope (10 Be) believed to roughly follow the open flux of magnetic activity from the Sun, and a reconstruction of geomagnetic activity, itself believed to follow the open flux from the Sun.
- This is the first physical mechanism that could contribute to understanding the well known correlation between solar cycle length and northern hemisphere mean temperature published by Friis-Christense and Lassen (1991, Science, 254, pp698-700):
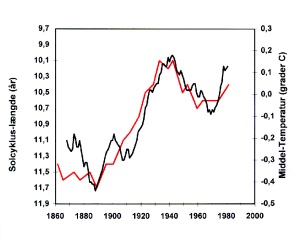 (figure from public website).
 - The previous figure is sometimes argued as justifying the assumption that observed climate changes are entirely solar induced. As well as pointing out that the previous figure is only a correlation, that could be explained by a number of factors (or indeed be a statistical fluke), Solanki concludes with a reconstruction of the last 150 years of irradiance, which he then compares with climate records, to show that the most recent two or three decades of warming are not correlated with the solar irradiance … and thus could be explained by anthropogenic warming:
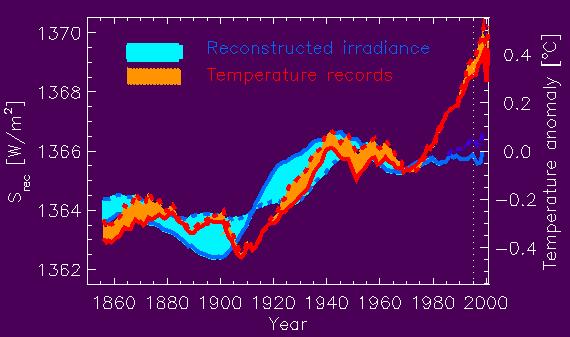 The above figure is a version of the last figure from Solanki’s paper, taken from his institutes public website. The key lines are the blue ones, which are the irradiance reconsructions, and the red lines which are the climate records.
Having discovered their public website, I also had a look at Solar total and spectral irradiance: Modelling and a possible impact on climate (N.A. Krivova & S.K. Solanki 2003, ESA SP-535, 275-284). An interesting figure, and accompanying discussion from that paper was the one which showed that the recent flurry of interest in cosmic rays and clouds cannot explain the last thirty years of temperature increase either:
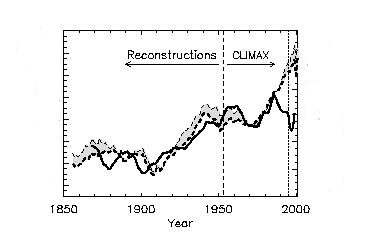 (the y-axis information has been removed to comply with my fairuse criteria, but the solid curve is the cosmic ray flux, and the other curves are the climate record).