Workload - Where does Bryan spend his time?
I’ve always wondered where I spend my time. I keep records for some projects because one has to, but I’ve never found a way of recording interesting information easily enough. That changed recently: it turns out it is now possible to get a handle on where you spend time pretty easily, and at the same time learn about what applications you use most.
At the end of January I did some due diligence on tools and installed an app to monitor what I spend my time doing so that I could consciously modify the amount of time I spend wearing my various hats (in the Computer Science Department, in the Meteorology Department, working for NERC, and working for NCAS, working on grants etc), so that I know whether they are all getting value for money.
The plan is that I will evaluate the time every quarter, and deliberately spend more or less time in various areas over the next quarter so that over a year the percentages of time I spend where correspond to the financial inputs from NERC, NCAS, and the University.
The app also monitors which application I am using when I am using my Mac laptop/desktop.
Here are the results from February and March (a short quarter, given I didn’t have the tool in place til the end of Jan). Most of you wont be interested in how I spent my time against income, but you might be interested in the distribution of time against applications etc.
The rest of the post is in four sections: a look at my overall workload, an analysis of which Mac applications I use a lot, the assessment of where my time is spent against project and funding (which is the reason I am doing this), and some conclusions.
Workload
The first thing that jumped out at me, was that over two months with 40 working days (allowing for Easter), I had spent 464 hours working - that’s an average 58 hour working week.
I have noted in the past that if I go much past 50 hours per week my productivity plummets, so I may not have been as productive as I would like during this period, but there were a lot of deadlines!
So, my first active conclusion is to try and work a little bit less - but that’s not always under my control. The problem with wearing a lot of hats, is some of them are quite demanding with deadlines that tend to be like buses, all arriving at once, and without the sort of lead times that allow one to plan to get things done in a calm sequential manner.
Applications
The pie chart shows where I have spent most of my time.
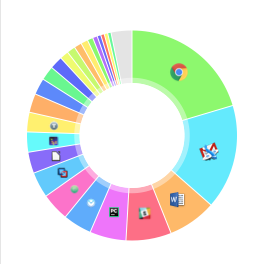
- It’s slightly deceptive in that email is in fact the winner (just over 15%), but because I use both Mailplane (mostly) and Airmail (sometimes) it gets two entries in the pie chart.
- Next and a close second is Google Chrome (also just over 15%) - but lest you think that’s just browsing, a lot of that time is spent in Google Docs … creating spreadsheets, presentation material, and (we will see) preparing bids for funding.
- A long way back in third is Microsoft Word at 5.5% - in third despite the fact that I only use it because of collaborations!
- Fourth is Slack, at just over 5% of my time (I have a distributed team, slack has made a real difference in productive communication).
- Fifth is time spent in LaTeX (4.5%, again this is deceptive because the pie chart hows I spent roughly equal times in TeXstudio and TeXShop - I’m transitioning away from the latter).
- Sixth is PyCharm (4%) - actually programming in python - mostly producing metrics for understanding JASMIN or some other aspect of national HPC.
- Atom comes in seventh with just over 3%, mostly spent creating markdown papers for reports … (I have changed to using MacDown for markdown lately, it will be interesting to see how this changes).
- VMware Fusion came eighth with just under 3% - I run a linux virtual machine on my Mac, and this will have been partly for working on a new Computer Science website, and partly on playing with real science data and tools.
- LibreOffice (2.5%) in ninth place is mainly used for drawing technical diagrams (I find LibreOffice Draw excellent for that).
- The top ten is rounded out with Finder (2%) - which is really scary, that’s a lot of time faffing around finding the right file to read or work on. I really have to do better than that.
Honourable mentions go to: Evernote and Nozbe who along with Acrobat Reader and Preview just missed out the top ten.
One big caveat on all this is that I think these statistics record where the mouse and keyboard focus lay, but with a big monitor (sometimes two), I clearly have and use lots of simultaneously open windows from multiple applications. So we might see these all as underestimates, particularly for the use of Preview and Reader.
What was I doing?
The software allows me to record what I am doing (separately from what application I was using), and I’ve been reasonably religious about recording that - although I have washed up a lot of “small email handling” and “self organisation” into an “overheads” bucket. Such overheads have taken up 11% of my (total) time working …
There are two ways of considering the rest of my time: in terms of percentages of a formal working week (say 40h) and of percentages of my actual working week (more like 58h in this period). In both cases to calculate the percentages, I first subtract the overheads time (so, that leaves just under 36h and 53h respectively as the total time spent on other activities). I do this because obviously the overheads time is spent as much on big things as on small things.
So here are some big ticket items:
- NCAS general management (meetings, staff and financial management, running the Models and Data division, providing HPC support to NERC) - 35% of my time in actual terms, 41% of a formal working week after overheads.
- EU grant renewals - 26% actual, 31% formal.
- JASMIN management (procurement, meetings, reporting) - 20% actual, 23% formal.
In the (very long tail of) noise are three other interesting numbers:
- Working on a new website for advanced computing in environmental sciences, around 4% (the difference in actual and formal weeks doesn’t matter much at this level)
- Actual academic writing - around 3%
- Doing this which might result in graduate students for our new group in computer science - 2.5%.
- Actual academic reading - around 1%.
These last are part of around 16/19% of my time that was spent on general computer science related activity.
Conclusions
Some conclusions from all of this?
- As already noted, I need to work a bit less.
- It’s fairly obvious why my blog was quiet in the first quarter.
- I need to spend much more time on academic reading and writing. Ideally that would be around 20% with the remainder of my university time spent on admin and supervising project work etc.
- EU grant renewal is a big overhead - on average most of the extra working week was associated with those (or the fact I couldn’t push anything else out in the weeks I needed to work on those bids)!
- The balance of NCAS effort was about right (it’s supposed to be 60/40 against university time, with JASMIN in the 60).
We shall see what happens in the next three months.