Workload Revisited
In April I reported my first couple of months of workload anlaysis using the timing app. I’ve now done three more months, so was interested to look at how I’d done.
A couple of conclusions from last time were that:
- I needed to spend much more time on academic reading and writing. Ideally that would be around 20% with the remainder of my university time spent on admin and supervising project work etc, and
- Given I averaged a 58 working week, I wanted to work a bit less and to try and get closer to a 50 hour week.
I didn’t actively monitor either of these things during the period, although I did conciously try to work less at weekends, and ignore a few deadlines in favour of reading and writing … (on the principle that much of what is urgent is not in fact important, and they teach you on time management courses to try and ignore the siren call of urgency unless it is important!)
So how did I do?
The headlines suggest rather well:
- Over the three months, allowing for holidays etc, I was on 49.8 hours per 5 working day week, which is as close to 50 as you’d like, given I wasn’t monitoring time directly!
- We will see that I was around 20% on academic reading and writing which again was pretty good.
Now the issue for the next quarter is can I keep that up?
The other two pieces of analysis I did were around what applications I used, and a more detailed look at the balance between my responsibilities.
Applications
Firstly, the pie chart shows where I have spent most of my time over the last quarter, at least in terms of time at the keyboard of my Mac:
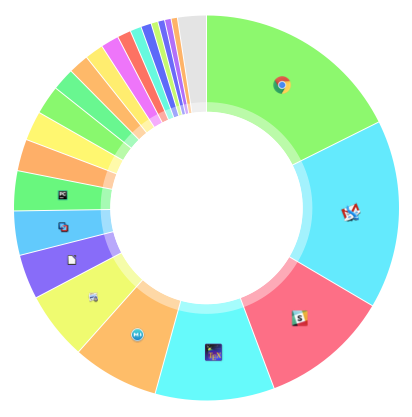
It’s kind of fun to compare with last time, so we will:
| App | Q2 Rank | Q1 Rank | Q2% | Q1% |
|---|---|---|---|---|
| Chrome | 1 | 2 | 11.5% | 15..2% |
| 2 | 1 | 10.4% | 15.3% | |
| Slack | 3 | 4 | 7.1% | 5.2% |
| TeXstudio | 4 | 5 | 6.5% | 4.6 % |
| MacDown | 5 | x | 4.7% | x |
| Preview | 6 | mention | 3.8% | x |
| PyCharm | 7 | 6 | 3.2% | 4.2% |
| LibreOffice | 8 | 9 | 2.5% | 9 |
| Fusion | 9 | 8 | 2.5% | 3.0% |
| PowerPoint | 10 | x | 1.6% | x |
| Word | x | 3 | x | 5.6% |
| Atom | x | 7 | x | 3.2% |
(*Pycharm appears twice in the stats, which is why it’s out of order with respect to the figure, I guess two different versions were recorded, but I obviously summed them here.)
What can we conclude from this:
- I still spend most of my time in the browser and mail … (Chrome and MailPlane – I pretty much ditched Airmail, it kept chewing up CPU).
- This quarter I had more time for interacting with my team and NCAS colleagues (Slack).
- Last quarter I spent more time working on external collaboration documents (Word), with nearly no use of it this quarter (since I wasn’t forced into it …)
- The foreshadowed migration from Atom to MacDown for Markdown editing was nearly total!
- Apparently when I am reading and working on papers I clearly read a lot of presentations (PowerPoint), read/annotate a lot of documents (Preview), use TeXstudio a lot, as well as LibreOffice (for diagrams).
- PyCharm and Fusion remain important for doing real work … (i.e fun things like programming for plots etc).
- (Not in the table, but the advent of HouhdahSpot for searching knocked Finder down a little bit, and I think has made a real difference for quickly finding material.
As last time, honourable mentions go to: Evernote and Nozbe, and don’t forget the caveat that I think these statistics record where the mouse and keyboard focus lay, but with a big monitor (sometimes two), I clearly have and use lots of simultaneously open windows from multiple applications. My focus may well differ from the pointer!
What was I doing?
Using the same methodology as last time - noting that I spent roughly 13% of my time in “overheads” (unassigned email, time management, computing environment etc) - which we distribute amongst the assigned activities, we get:
- NCAS general management (meetings, staff and financial management, running the Models and Data division, providing HPC support to NERC, looking after JASMIN)
- 57% (actual, 74% of a 40h week). (The target is 60%, last time it was 54/63).
- Within that JASMIN consumed 16/21% of my time, and direct support (advice/representation) for NERC HPC on top of JASMIN support an additional 7.8/10.1%).
- Academic Reading and Writing (reading being defined as reading done that wasn’t necessary for a specific task):
- Reading 1.7/2.2 (cf 0.8/1.1 last time)
- Writing 18.6/24 (cf 2.8/3.3 last time)
- Working on the ESIWACE1 project in some way:
- 13.8/17.9 (last time I was mainly working on ESIWACE2, which was 9.2/10.9)
These are again in the right ball park for my various responsibilities, although JASMIN + HPC workload ought to be nearer 20 than 30% of my time.
Conclusions
Some conclusions from all of this? Pretty pleased that my default juggling of time seems to be giving the right outcomes both in terms of my various responsibilities, and a more sensible work/life balance.
It will be interesting to see how the advent of the IPAD affects these various percentages, either because I can’t measure things as well (more time on the IPAD) or some activities get moved from the Mac to the Ipad (or not).